XtalPi raised $785M at a $2B+ valuation. OrbiMed, SoftBank, and HOPU invested in AI-driven drug discovery at the intersection of quantum physics and laboratory automation. Wizardly built the brand system and interactive website that projects that credibility to the global pharma market.
82 design assets. 6 months. Brand system + interactive site.
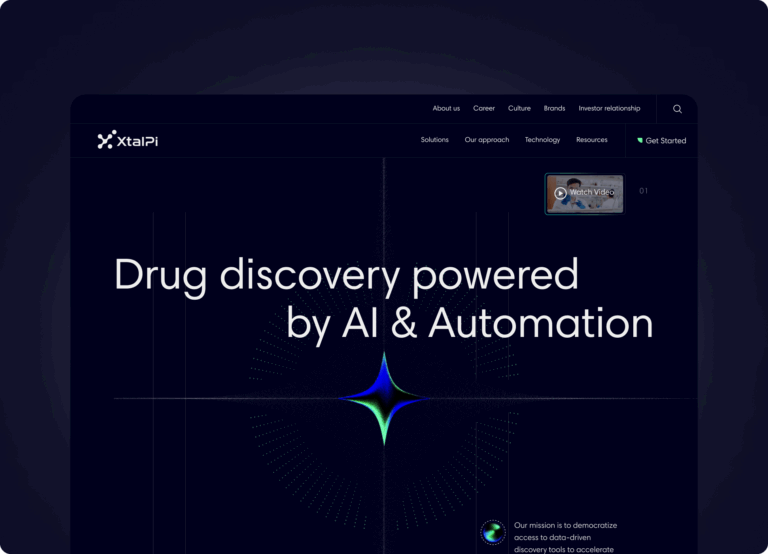
This wasn't a website redesign — it was a complete brand and digital platform build. Wizardly delivered a new brand identity, interactive web experience, custom illustrations, charts and graphs, and animation over a 6-month engagement. For a company operating at this scale, the digital presence needed to match the science and the investment behind it.
The site serves as XtalPi's primary digital gateway for pharma partners, investors, and talent worldwide — in both English and Chinese markets.
A production-grade business development asset.
Scientific audiences don't just care about design. They reward it.
For an AI drug discovery company selling complex, multi-year partnerships, engagement depth matters more than raw traffic. XtalPi's site excels here — service pages averaging 90–113 seconds, with engagement rates between 85–98%.
| Page | Avg Engagement | Engagement Rate |
|---|---|---|
| A Pioneering AI Drug Discovery Company | 134.5s | 81.3% |
| Hit Discovery | 112.8s | 86.8% |
| Five Stages of Drug Discovery | 101.3s | 76.4% |
| Digital Chemistry | 94.5s | 83.6% |
| Revolutionizing Technology for AI Drug Discovery | 90.6s | 77.7% |
| News & Events | 89.8s | 78.5% |
| Contact Us | 61.6s | 77.0% |
154 pages generating conversions. The entire site is working.
This isn't a homepage and contact page doing all the lifting. Conversion events are distributed across 154 different pages — meaning the content architecture is guiding visitors through complete evaluation journeys.
| Page | Views | Key Events | Engagement Rate |
|---|---|---|---|
| Drug Discovery Partner (Homepage) | 34,438 | 29,441 | 85.2% |
| About XtalPi | 6,745 | 5,672 | 89.3% |
| Solutions | 4,171 | 3,483 | 93.0% |
| News Center | 3,468 | 2,991 | 94.6% |
| Publications | 2,463 | 2,122 | 97.3% |
| Contact Us | 2,447 | 2,077 | 91.2% |
| Small Molecule | 2,102 | 1,791 | 89.7% |
| Biologics Discovery Download | 1,202 | 1,026 | 96.9% |
| Synthetic Chemistry Services | 961 | 872 | 96.8% |
96–98% engagement rates on resource pages.
The site's resource pages — publications, webinars, downloads, and video — show engagement rates that are nearly perfect. Almost every visitor who lands on these pages actually engages with the content.
61 seconds average engagement on a contact page.
Visitors aren't just clicking through. They're carefully filling out inquiry forms, reading partnership information, and considering how to engage. When you sell multi-million-dollar drug discovery partnerships, every form submission is a potential seven-figure conversation.
Consistent performance at scale.
Zooming into the most recent 6-month window confirms the site is sustaining its performance — not just riding a launch spike.
What worked — and what to watch.
We don't cherry-pick. Here's the full picture.
What Worked
325,000+ English page views. 76,759 key conversion events across 154 pages. This is a production-grade digital asset driving global BD.
Service pages averaging 90–113 seconds with 85–98% engagement rates. Scientific audiences reward good design with the deepest engagement we've measured.
Publications (97.3%), webinars (98.3%), and downloads (96.9%) all show near-perfect engagement. The content engine is working.
~90 form submissions/month over 17.5 months. ~56/month in the recent focused window. Sustained pipeline generation, not a launch spike.
What to Watch
Chinese site views dropped significantly in the Nov–Apr window (344K full range vs. 2K in 6 months). Likely a tracking change or site migration — worth investigating.
At least 3 different title tags appear in the data, suggesting A/B testing or site evolution. Consolidating tracking would sharpen attribution.
40 specific key events against 12,785 contact page views suggests the conversion tracking may not be capturing all meaningful actions on that page.
The full data range starts Apr 2024, which appears to be post-launch. This case study demonstrates performance at scale rather than before/after improvement.
Does your digital presence match the scale of what you've built?
When investors, partners, and talent evaluate your company, the website is often the first thing they see. If it doesn't project the credibility your science deserves, you're leaving trust on the table.
Start a ProjectData source: Google Analytics 4 — xtalpi-EN property (English site only unless noted).
No pre-Wizardly baseline available — data begins post-launch.
Key events include all measurable engagement and conversion actions tracked in GA4.
Prepared by Wizardly · wizardly.co
See the work behind the numbers.
The results don’t happen without great design. Take a look at the visuals we created for XtalPi during this project.

